Henrique Oliveira
DATA SCIENTIST
Get the Full Potency of your Data
Welcome to the HO portfolio webpage! 🧑💻 As a data scientist, I aim to create tools that facilitate data analysis for experts and amateurs. Let's work together and discover the full potential of your data. Here's how I can help:
Manipulate large data , create data visualization and machine learning models .
Develop intuitive and captivating data science reports .
Build interactive apps that enable real-time exploration of your data.
Manage a data analysis project through every stage of development until deployment .
What porfolio are you interested in?

Known more About Me
Data-driven Mindset
BSc Chemical Engenieer & MS Energy Technology
Potuguese & Spanish & English
+55 (81) 99991-0182
Greetings! 🤝 As a skilled Brazilian engineer with 5 years of expertise in developing data science projects and providing valuable business insights to clients, I am here to help you unleash the full potential of your data.
Through my proficiency in data manipulation, visualization, machine learning models, statistical tests and interactive apps, I can assist you in optimizing your data and obtain important business insigths. Don't hesitate to contact me to get the best out of your data! 🙂
Academic Experience
Master in Energy Technology at the University of Pernambuco
Post-grad in Renewable Energy at the University of Pernambuco
Graduation in Chemical Engineering at the Federal University of Pernambuco
Professional Experience
Data Scientist at Upwork . From November 2018 to Nowadays
Data Scientist at Arctoris . From May 2021 to November 2022
Data Scientist at Truss Investments. From December 2020 to May 2021
Clients Feedback
It was a pleasure working with HenriqueArctoris Ltd
Henrique delivered good work on this python development project and I enjoyed working with him. His communication was top-notch, he met all deadlines, and his skills were reasonably strong. I enjoyed working with Henrique and will likely have additional jobs for him in the future.Truss Investments
Excellent communication and expert in R. He solved my problem in one hour!Spyridon Hab
Henrique is a fantastic data scientist. He helped me with a project that was specifically challenging for me. He not only was able to complete it on time but took the time to explain things to me in a way that I understood. I left more knowledgeable in R and machine learning as a whole. Thanks so much!Axios Enterprises, LLC
Interactive Apps
Table of Contents:
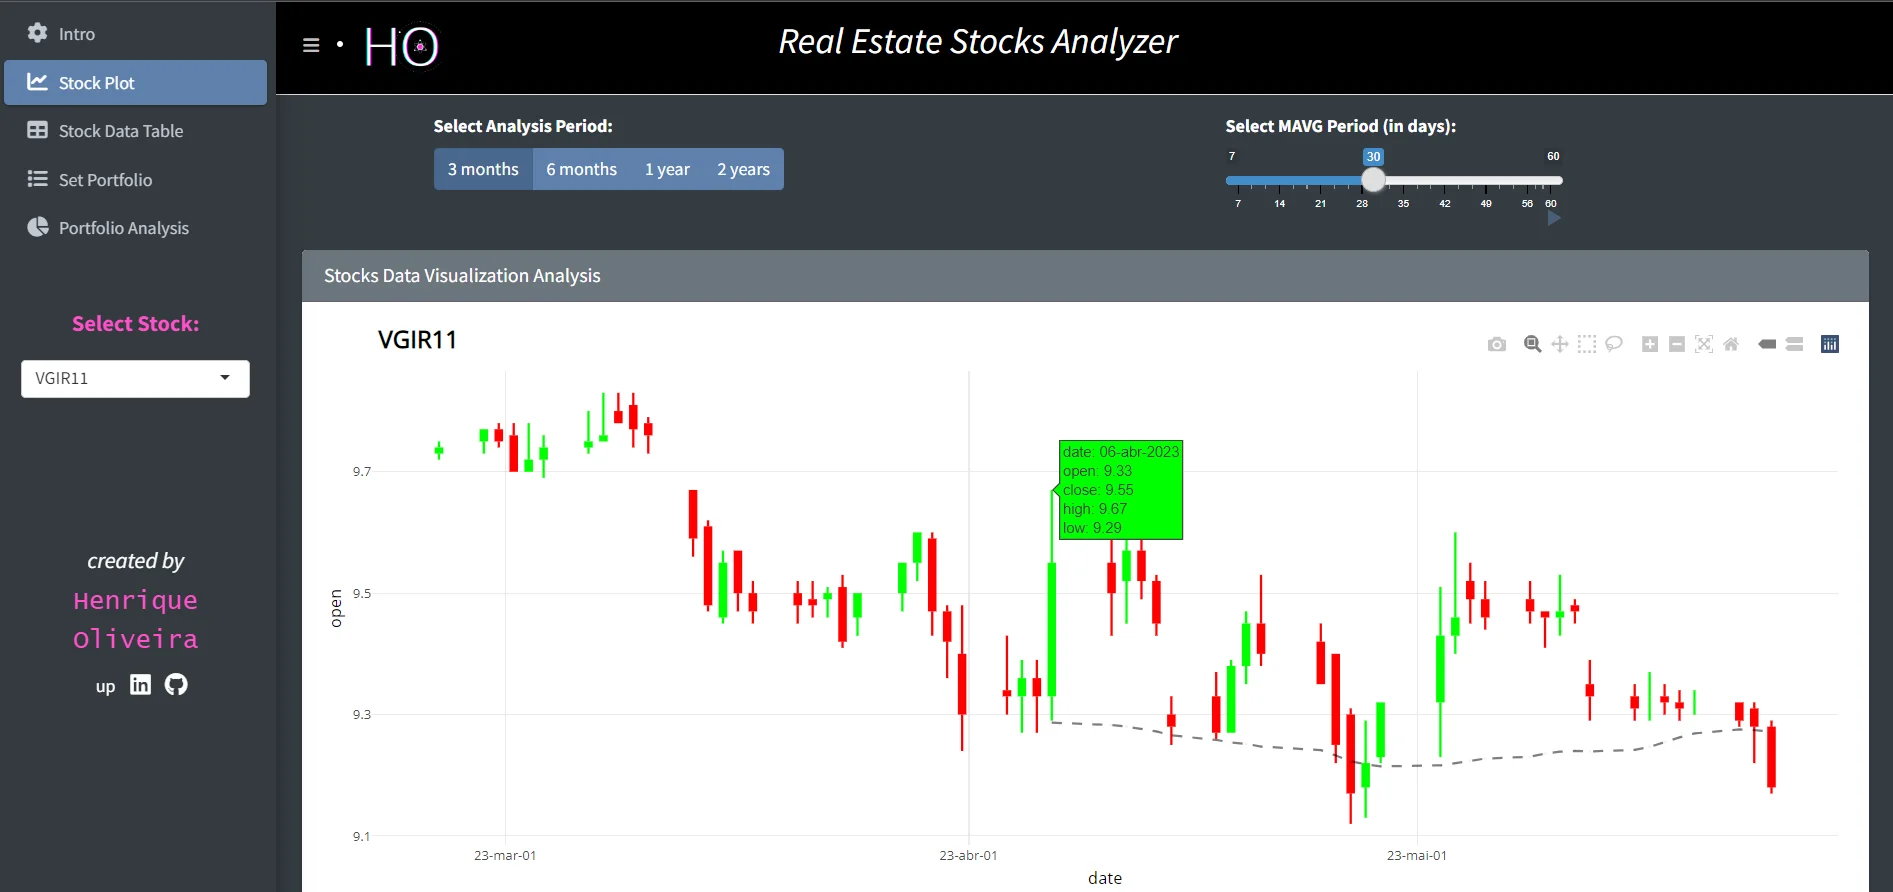
Real Estate Stock Analyzer
created in May 2023
The app allows users to analyze Brazilian real estate stocks and manage their stock portfolio. The app contains interactive plots and a table of the available stock data. Furthermore, the user can add stocks to a portfolio by specifying the stock code and quantity.
- tidyverse
- shiny
- yahoofinancer
- bs4Dash
- DT
- fontawesome
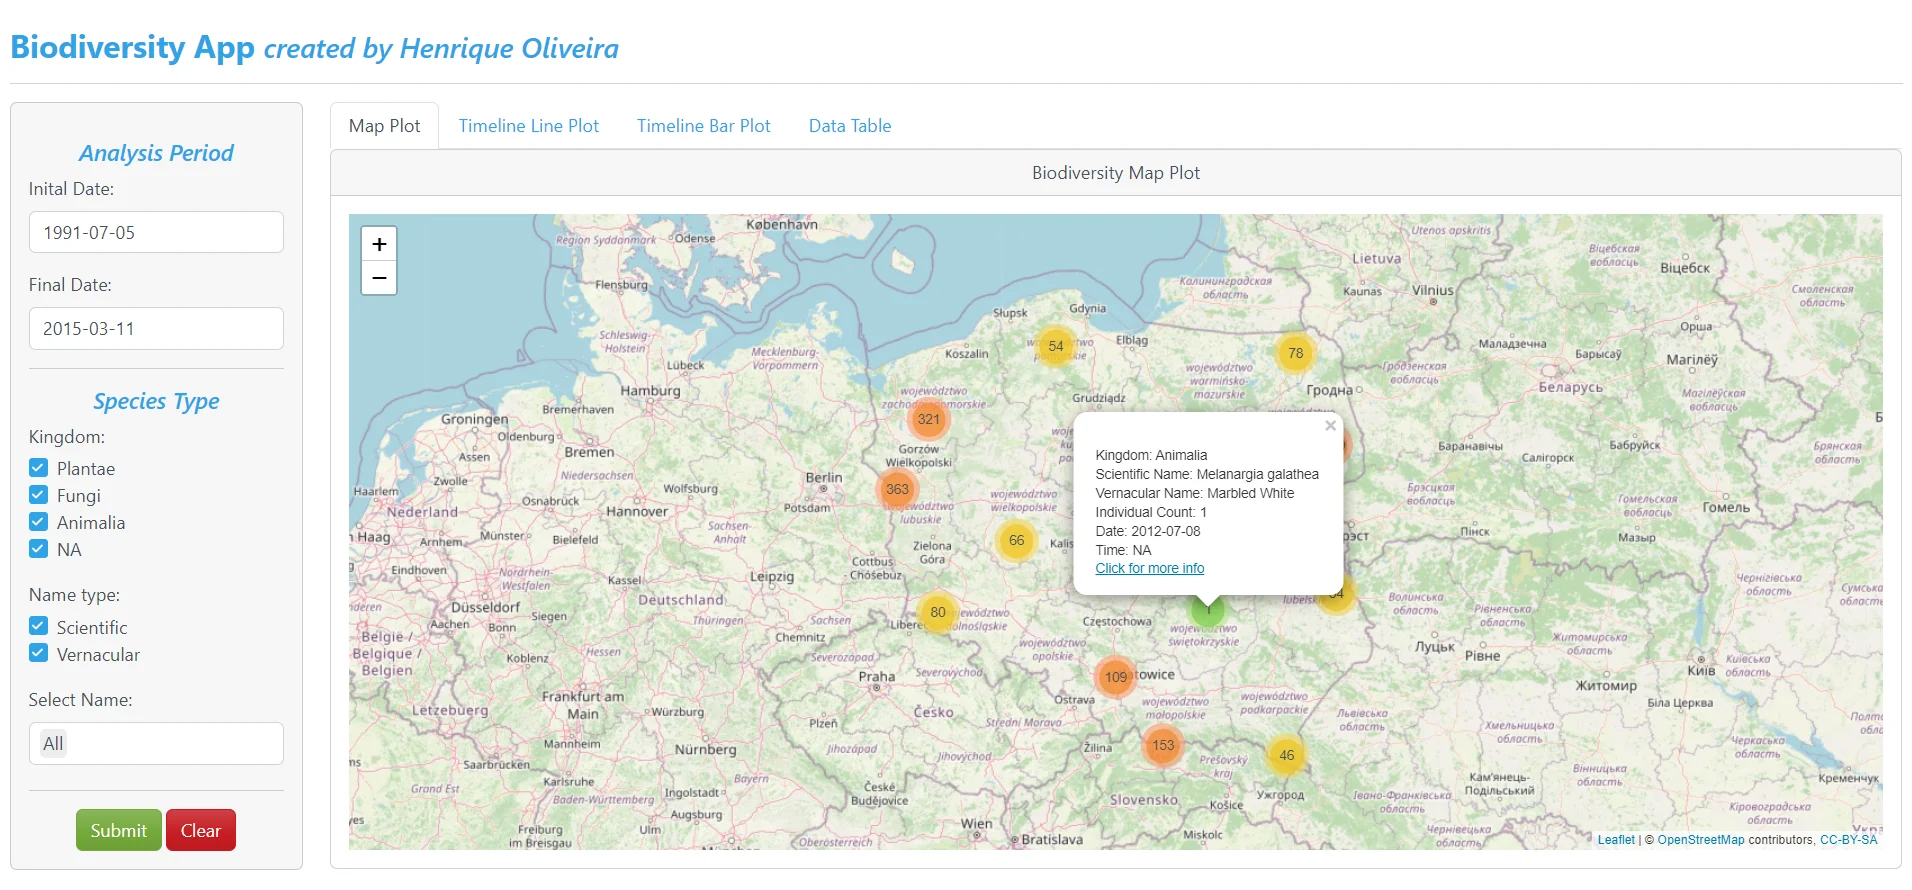
Biodiversity Analyzer
created in January 2023
The app displays information about the biodiversity in Poland. Allows the user to filter the data by date range, species type (kingdom), and species name (scientific or vernacular). To display the info the app contains four tabs: a map plot, a timeline line plot, a timeline bar plot, and a data table.
- tidyverse
- shiny
- shinyWidgets
- plotly
- DT
- leaflet
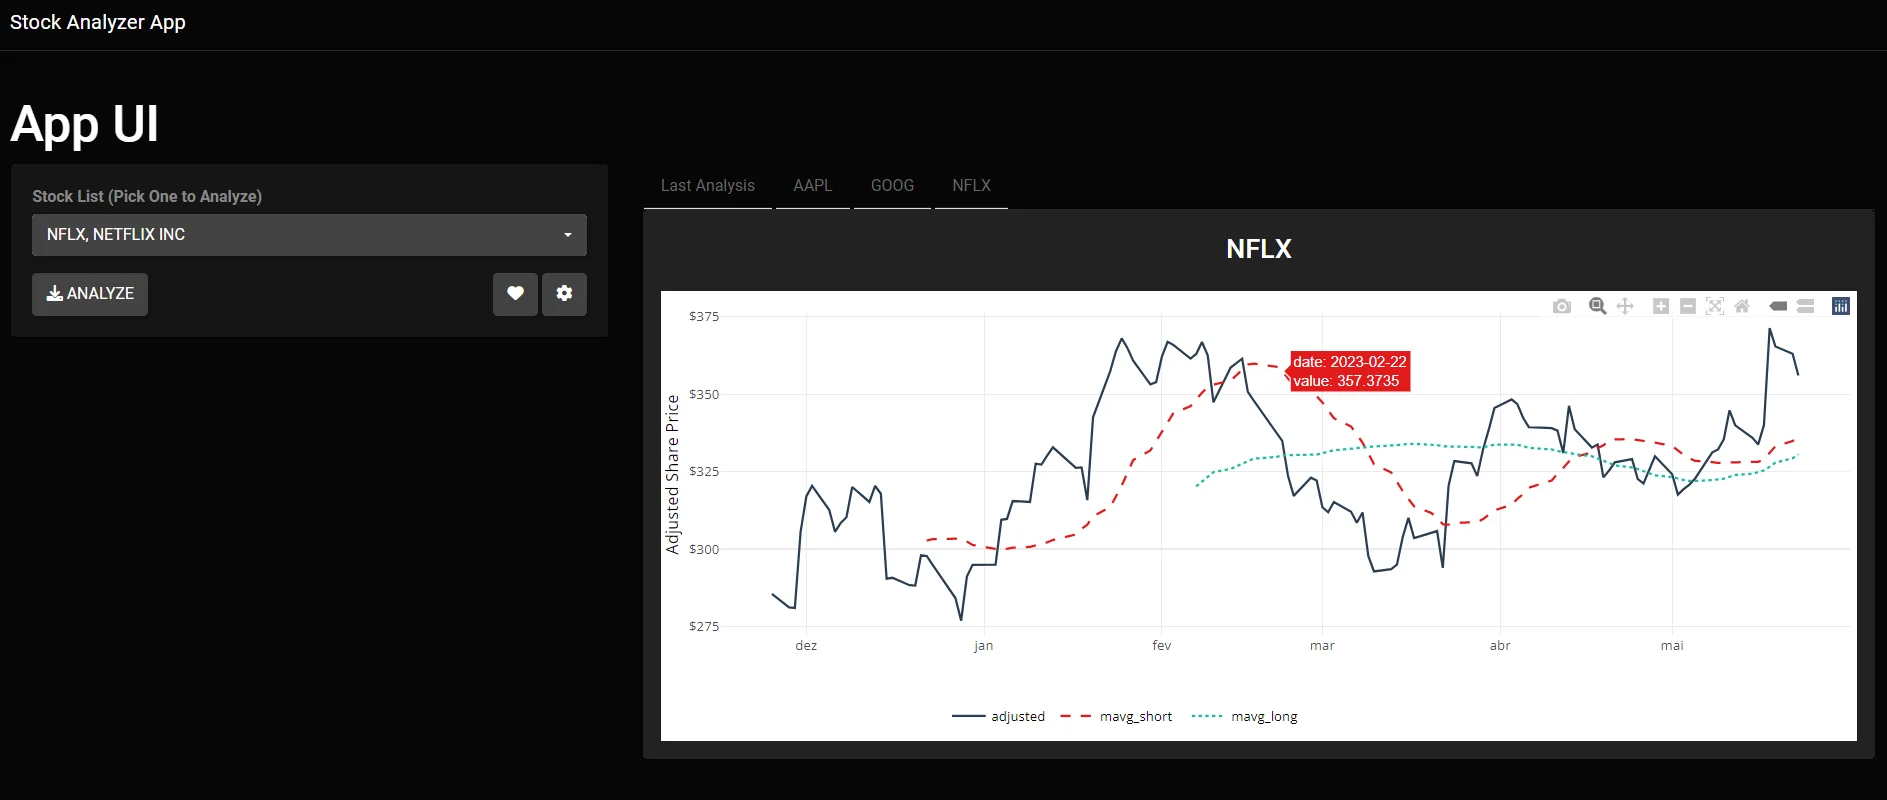
Stock Analyzer
created in July 2022
A financial app for analyzing trends in your favourite SP 500 stocks. The app uses an API to get the stock data and allows users to analyze and visualize stock data. Users can customize settings such as moving averages and analysis time windows. Furthermore, users can also add or remove favorite stocks.
- tidyverse
- tidyquant
- shiny
- shinyWidgets
- plotly
- shinyjs
Data Science Reports
Table of Contents:
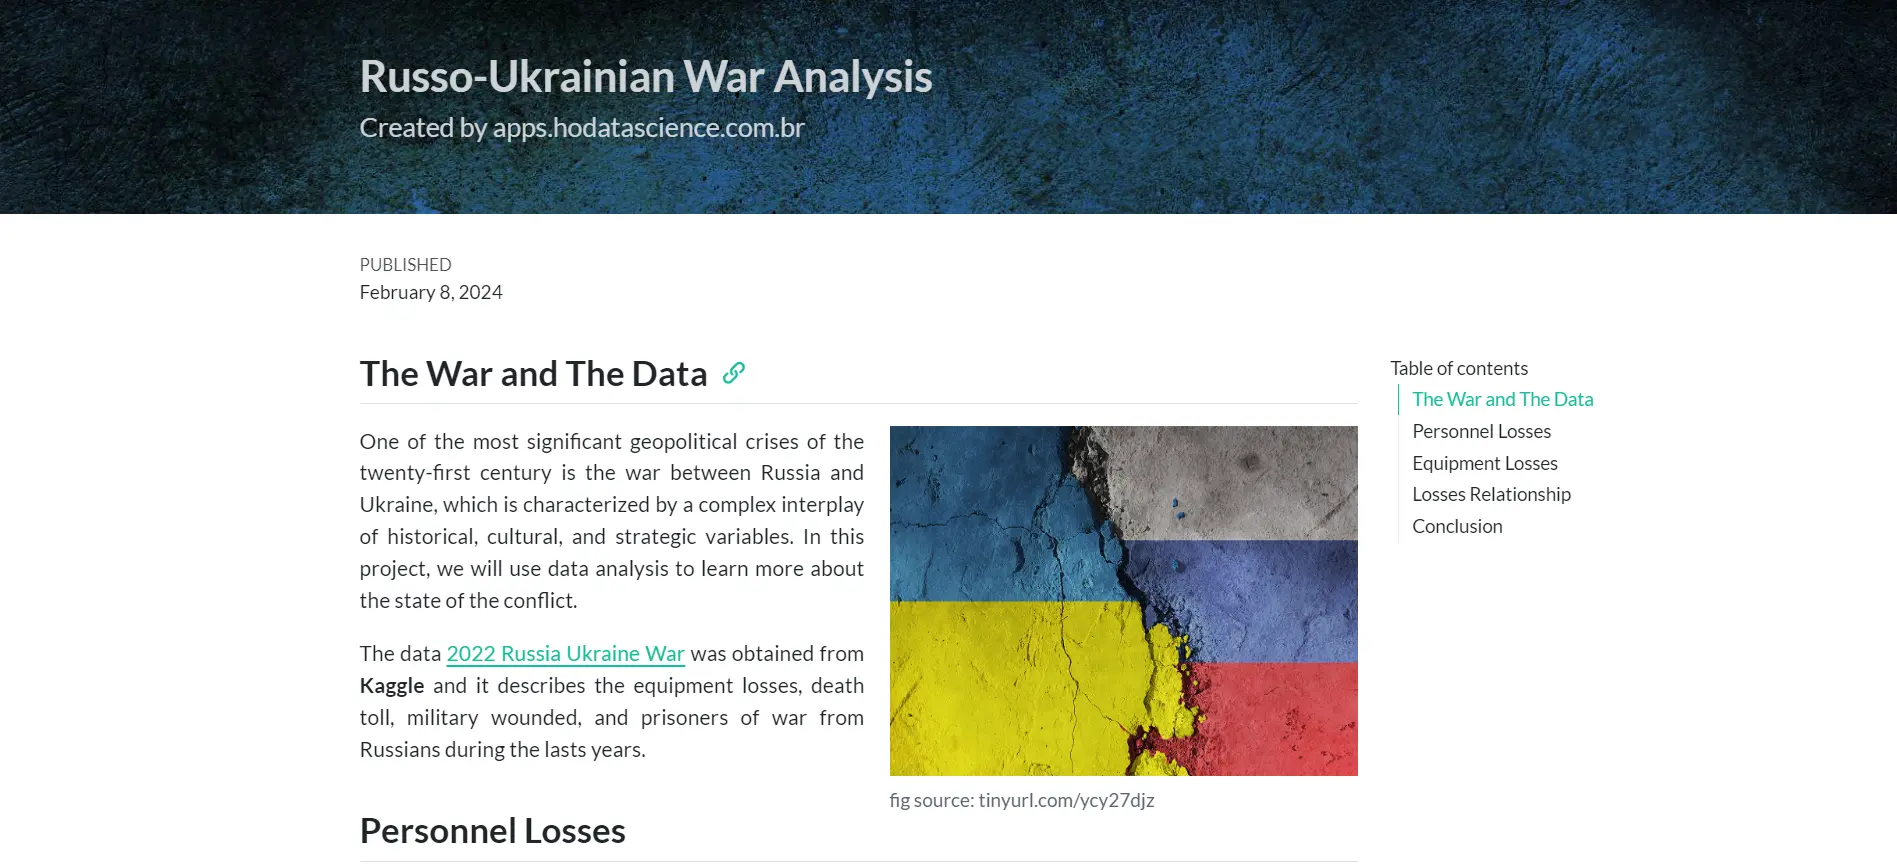
Russo-Ukrainian War Analysis
created in February 2024
One of the most significant geopolitical crises of the twenty-first century is the war between Russia and Ukraine. This project uses data analysis to learn more about the state of the conflict.
- tidyverse
- quarto
- plotly
- kableExtra
- bslib
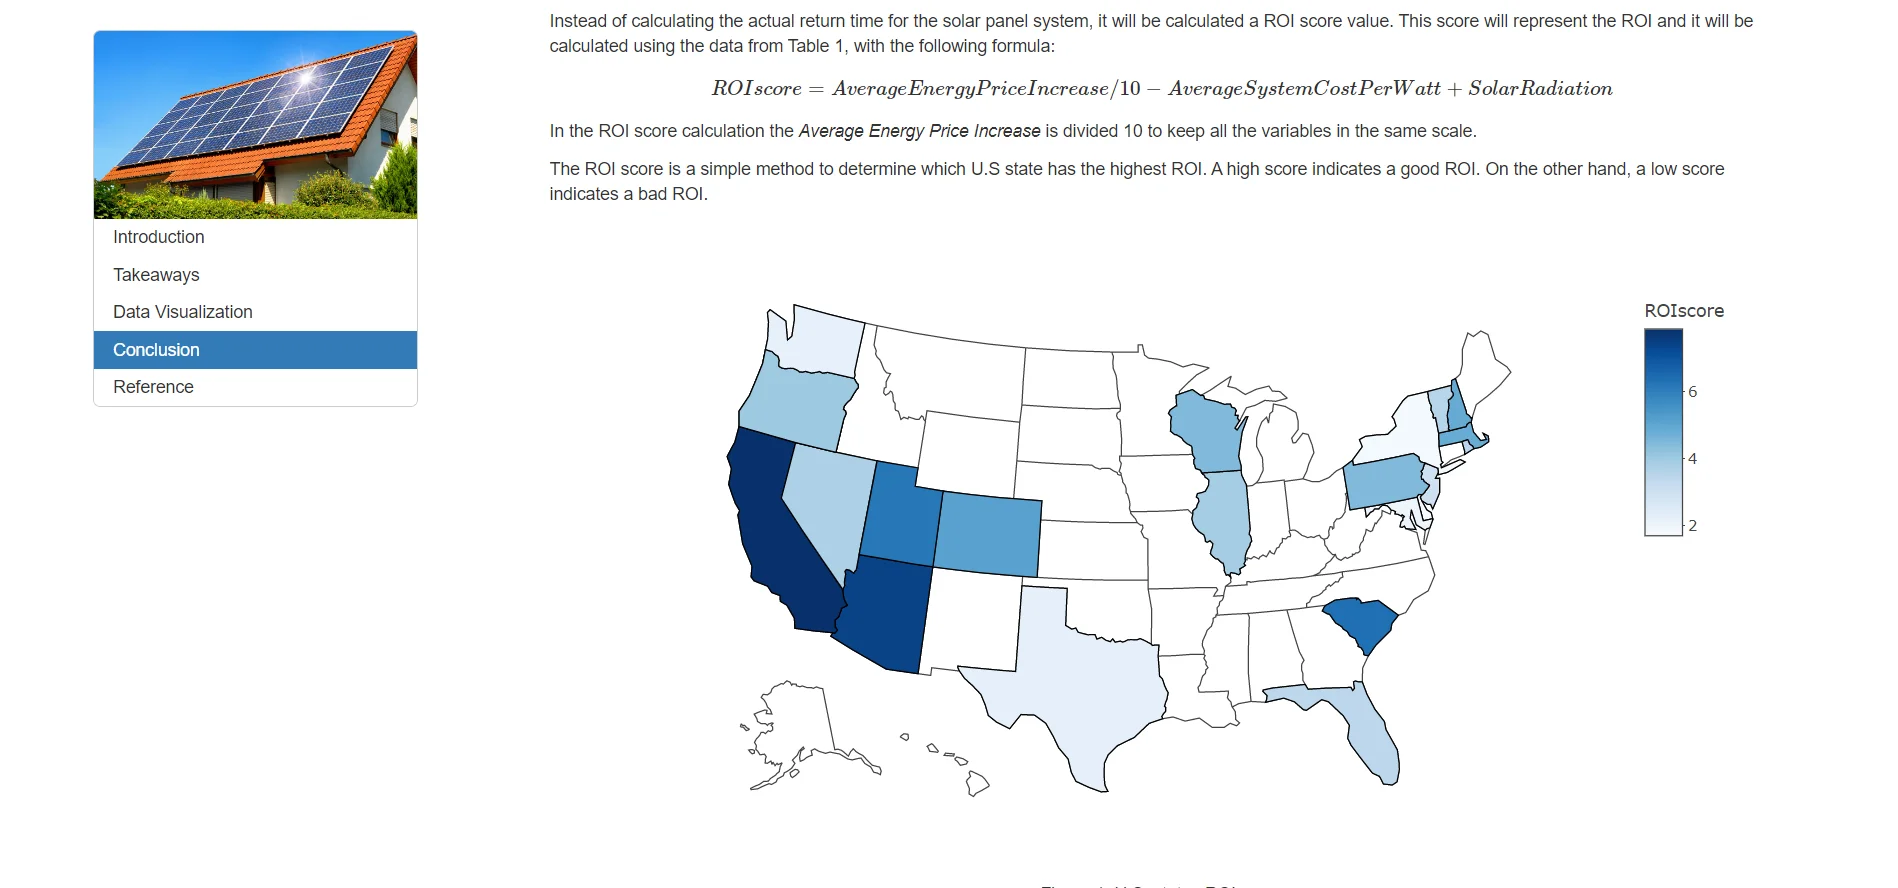
Solar Panels ROI Analysis
created in October 2022
The project objective is to analyzes Solar Panels Return on Investment (ROI) in U.S.A. states, which is calculated by considering the investment cost, the money saved on energy, the money made by selling extra energy, and the incentives of federal/state tax credits.
- tidyverse
- rmarkdown
- plotly
- DT
- htmltools
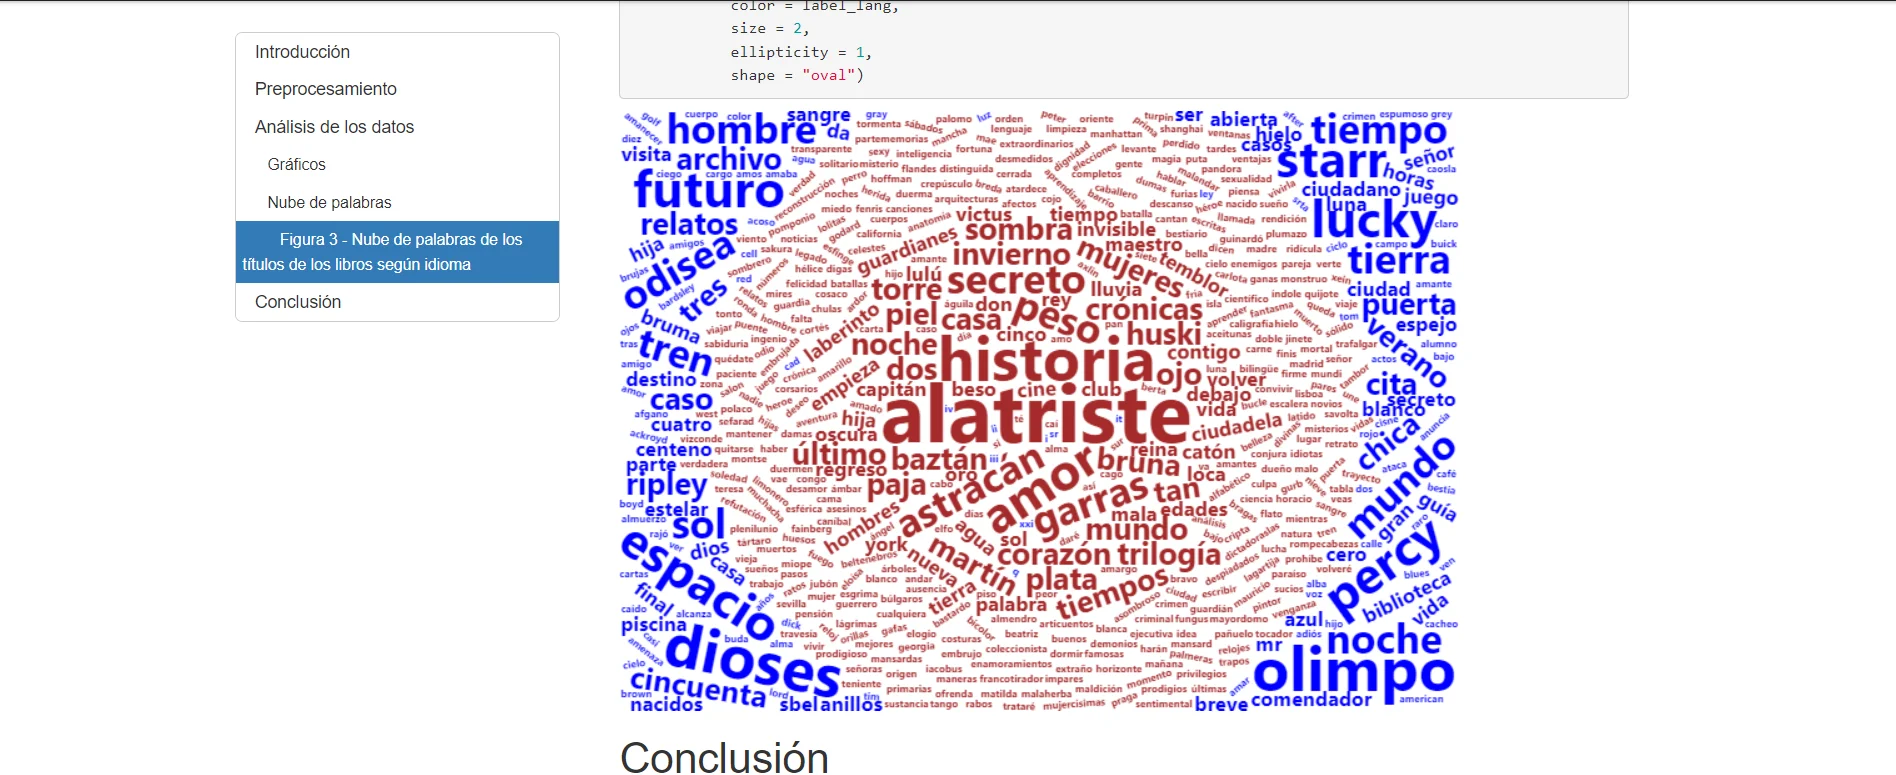
Books Text Analysis
created in July 2020
The article discusses the analysis of a dataset containing information on books written in English and Spanish. The dataset includes the title, category, and the total count of different types of word classes in the books.
- tidyverse
- rmarkdown
- plotly
- tidytext
- stopwords
- wordcloud2